
Reviews
Part of Five kinds of ferry route, told through the water each one crosses
How to compare routes using charts and zone forecasts
Compare ferry routes properly using nautical charts and offshore zone forecasts, so you judge the water each one crosses rather than the marketing.
What to take away
- Compare routes on the water they cross, using the same two sources for each: the chart and the zone forecast.
- The charts are NOAA's Electronic Navigational Charts (ENC) and Raster Navigational Charts (RNC), and 33 CFR 164.33 is the rule that requires most commercial vessels to carry charts in U.S. waters.
- Offshore forecasts are organized by zone, each with a text description and a Universal Generic Code whose prefix — PZZ, ANZ, AMZ or GMZ — tells you which waters it covers.
- A route that crosses two zones is two forecasts, and often two different days.
Use the same two sources for every route
Route comparisons usually collapse into reading operator pages, which tells you about marketing rather than about water. A better method uses two sources per route and nothing else at the first pass: the nautical chart, and the forecast product for the zone or zones the route crosses.
Chart vs forecast: what to read
Nautical chart
- Depths
- Along the track
- Hazards
- Obstructions, dangers
- Shoreline
- Configuration
- Aids
- Navigation marks
- Shelter
- Anchorages
- Wind
- Not shown
- Waves
- Not shown
- Visibility
- Not shown
Zone forecast
- Depths
- Not shown
- Hazards
- Not shown
- Shoreline
- Not shown
- Aids
- Not shown
- Shelter
- Not shown
- Wind
- Speed, direction
- Waves
- Height, period
- Visibility
- Fog, visibility
Keeping the sources identical is what makes the comparison mean anything. If you read a chart for one route and a review site for another, you have not compared them, you have compared two different kinds of impression.
Use the same two sources
| Read on the chart | Read in the forecast |
|---|---|
| Depths along the track | Wind speed and direction |
| Obstructions and hazards | Wave height and period |
| Shoreline configuration | Visibility and fog |
| Aids to navigation | Watches, warnings, advisories |
| Anchorages and shelter | How conditions change over the period |
Charts are documents, not illustrations
Understand what a chart is before using one. NOAA describes the nautical chart as one of the most fundamental tools available to a mariner. It is a map of the shoreline and seafloor that gives water depths, dangers to navigation, the locations and characteristics of aids to navigation, anchorages and other features, and it is essential for safe navigation.
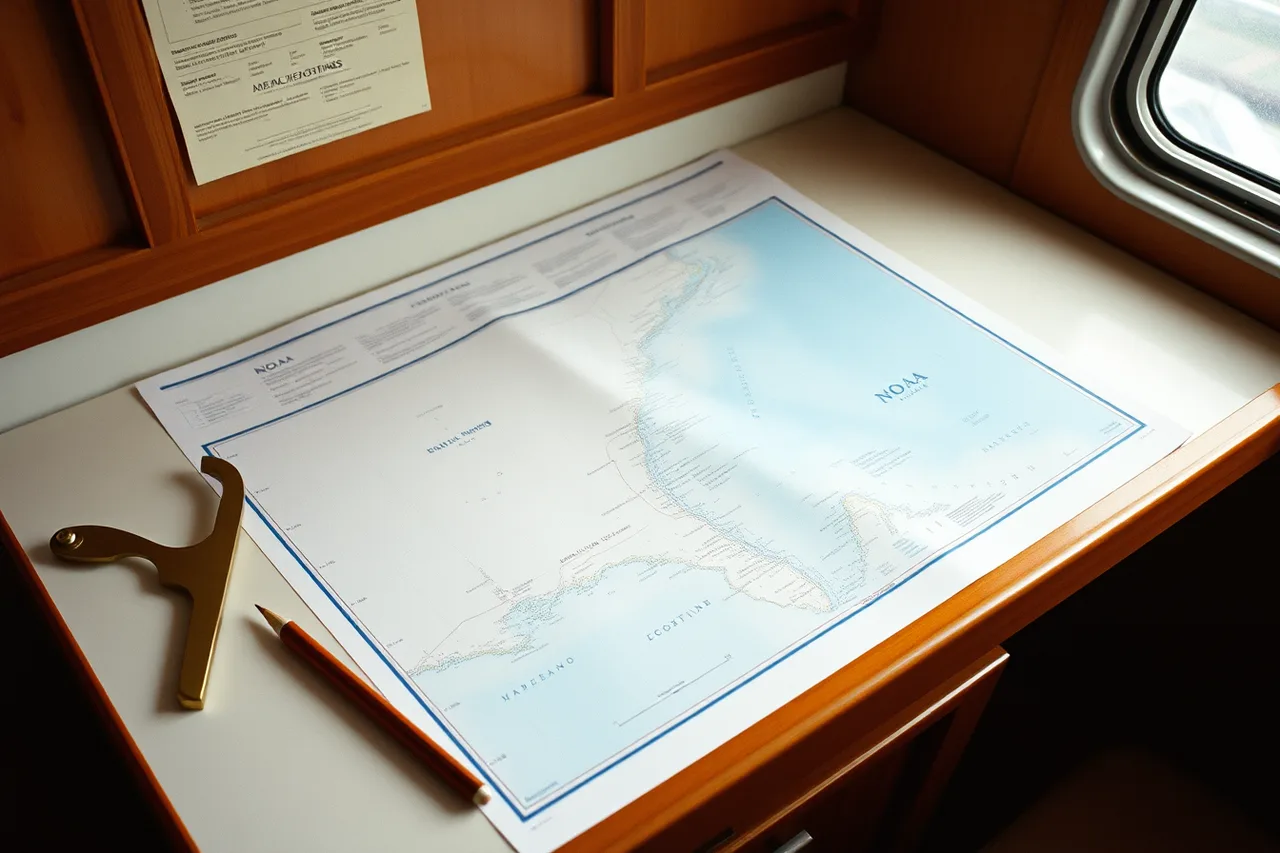
Federal regulations require most commercial vessels to carry electronic or paper nautical charts while transiting U.S. waters; the chart-carrying rule is 33 CFR 164.33, in the Coast Guard's navigation safety regulations. NOAA's Office of Coast Survey, which traces its chartmaking back to the mid-1830s, remains responsible for creating and maintaining charts of U.S. coastal waters. The products a passenger can actually open are the Electronic Navigational Charts (ENC) and Raster Navigational Charts (RNC) published for U.S. waters, the free BookletCharts, and U.S. Chart No. 1, which decodes the symbols used on all of them.
That regulatory status is why a chart is the right document for a comparison. It is maintained to a standard, and it says the same thing to everyone.
Know which forecast zone applies
The second source needs the same care. The National Weather Service publishes offshore waters forecasts subdivided by zone, each identified by a text description and a Universal Generic Code — a three-letter prefix plus a number. The prefix tells you which waters you are reading: PZZ for the Pacific coast, ANZ and AMZ for the Atlantic, and GMZ for the Gulf of Mexico. The forecasts are prepared by the Ocean Prediction Center, the National Hurricane Center and the Honolulu, Juneau, Anchorage and Fairbanks forecast offices, and they are published on the National Weather Service's marine forecast pages.
Parallel pages exist for coastal and Great Lakes zones — the lakes use their own prefixes, LHZ, LMZ, LSZ, LEZ and LOZ — and for high seas forecasts. The page warns that linked data may not represent the latest forecast, so always check the issue time.
A longer route can cross from a coastal zone into an offshore zone. When it does, read both. The zone boundary is frequently exactly where the sea state changes, which is also why passengers often report that a crossing was fine for half an hour and then was not.
Turning it into a comparison
Score each route on exposure, on the number of zones it crosses, on how sheltered the terminals are, and on how much shallow ground sits along the track. Then add the operational variables: frequency, seasonal pattern, and what waits at the far end.
That gives you a comparison built on the water rather than on adjectives. The operator-behavior half of the same question is in our guide to comparing operators on bad-weather handling, and the route archetypes are in our ferry route types guide.
Two crossings, worked through
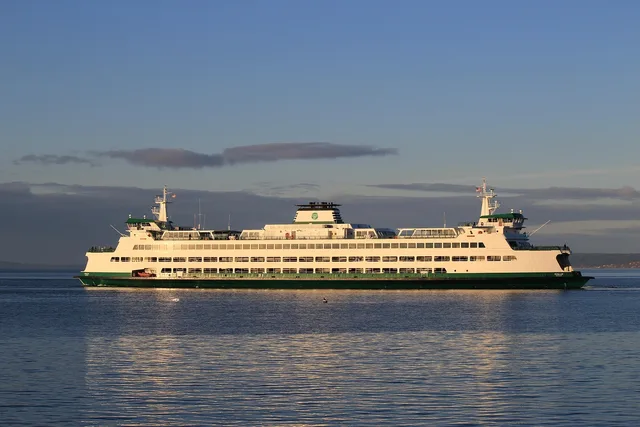
The method only proves itself on named water, so run it over a pair of real crossings. Edmonds–Kingston on Washington State Ferries crosses the main basin of Puget Sound: the chart shows a broad, deep channel with little along the track, and the forecast is a single inland-waters zone. Anacortes–Friday Harbor, the San Juan Islands run on the same system, is a different document — the chart carries island shorelines, narrow channels and tidal passes, and the zone that matters is the one covering the San Juans.
Neither crossing is "better." The comparison is about what each one asks of the water: one chart and one forecast that rarely surprise you, against a chart you read pass by pass. Run the same exercise on the Block Island ferry out of Point Judith, Rhode Island, and the Cape May–Lewes ferry across Delaware Bay, and the gap between a boat that leaves sheltered water for Rhode Island Sound and one that crosses an open bay entrance shows up before you read a single operator page.